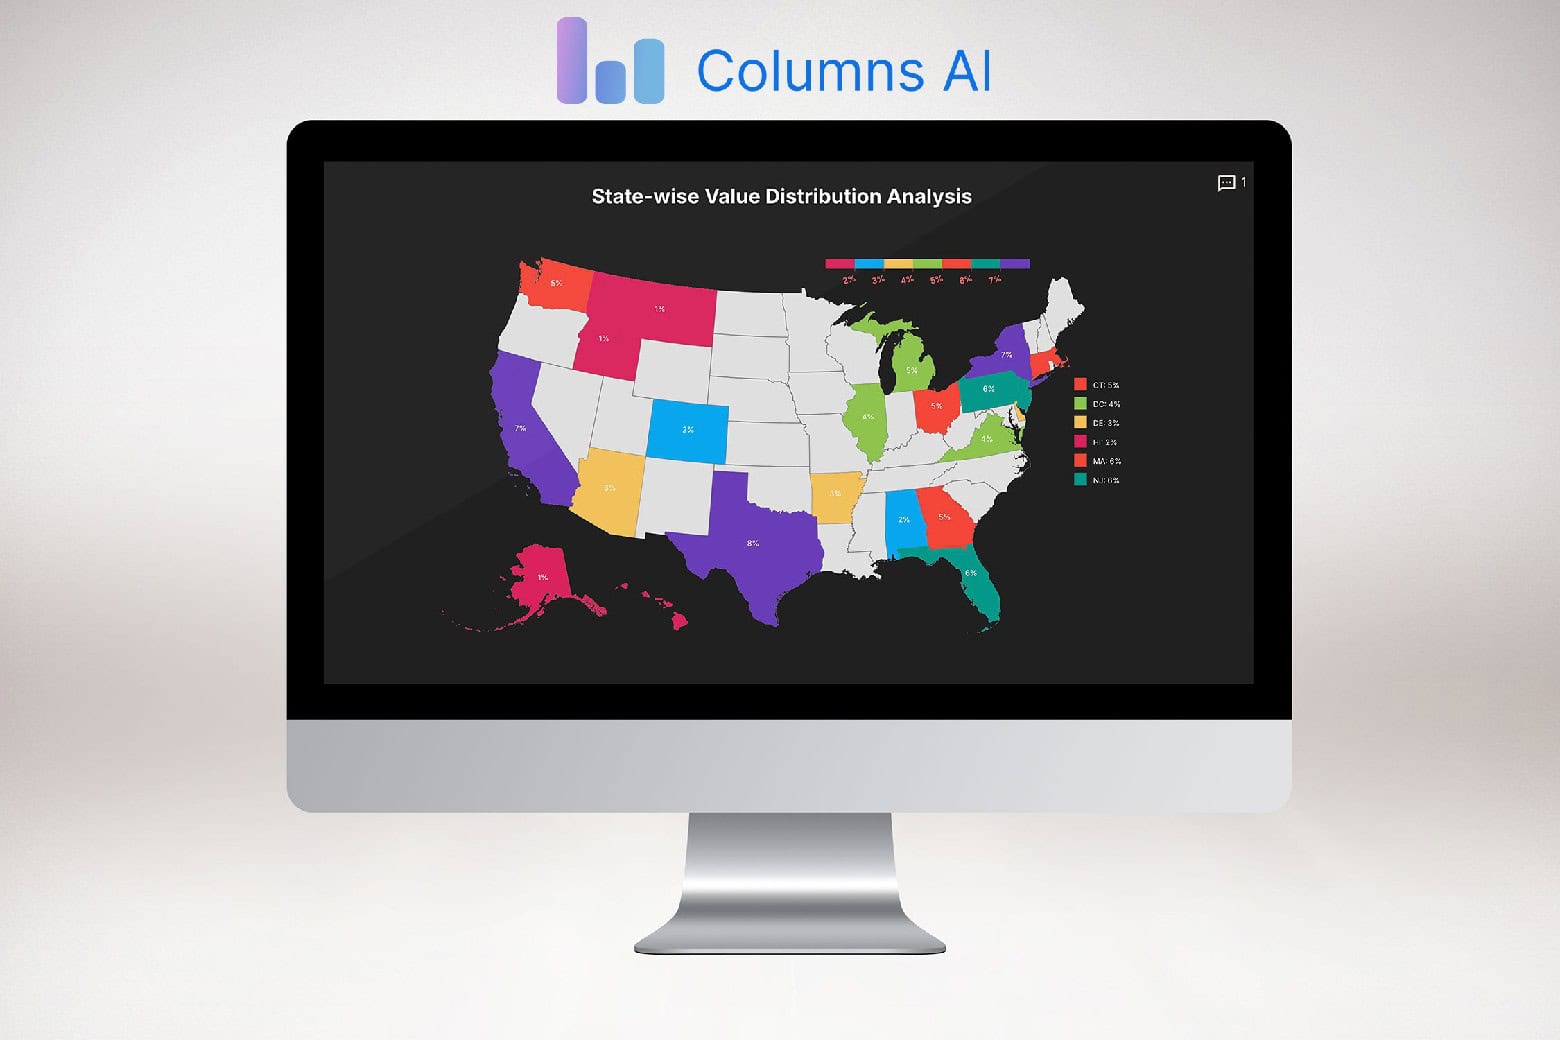
Creating effective bar charts, line graphs and other presentation visuals takes skill — unless you use artificial intelligence to handle the heavy lifting. Columns AI takes your data and automatically generates all the imagery you need to spice up your presentations and reports.
It’s much more accurate and intuitive than something like ChatGPT. And right now, you can secure a lifetime subscription for just $79 (regularly $900).
Create bar charts, line graphs and more from your data with Columns AI
We’ve all fled to Google because we didn’t know how to make a chart or graph in Excel. Even if you’ve done it a dozen times or learned how in school, it’s hard to get those steps to stick. But now, just like almost everything, there’s an AI for that.
Apple Intelligence brought time-saving Writing Tools and fun Genmoji to iPhones, Macs and iPads. However, it doesn’t have anything quite like Columns AI. You can ask Siri for help generating a chart based on that G-Sheet saved in your iCloud Drive, but Apple’s AI assistant will likely be very confused.
How to make bar charts and line graphs with AI
With Columns AI, your Apple device is all you need to get started. Since it’s a browser-based app, you can use it on your Mac, iPad or iPhone for ultimate convenience. Simply upload your data source. (Columns AI works with Google Sheets, Notion, Airtable, SQL databases, CSV files and other formats.)
From there, you can generate the AI bar graphs or line charts with a single click. Columns AI offers preset models you can choose from, so you know you’ll get good results from the start. And if your data changes, your visuals update in real time.
Customize your visuals with easy design tools
While other tools make modifying the layout of your graphs and charts overly complex, Columns AI lays the tools out for you plain and simple. Change the scale, organization and shapes to fit your data storytelling needs.
Those who love Canva will appreciate this next part: Columns AI’s simple design tools will help you personalize your visuals to perfection. You can select a theme, color palette, background color and more with a few clicks.
Save 91% on this AI data visualization tool
If you’re ready to wave goodbye to the days of manually creating bar charts and other information-packed graphs, you need a Columns AI lifetime subscription. Get yours here for $79. That’s a massive 91% discount off the regular price of $900.
Buy from: Cult of Mac Deals
Prices subject to change. All sales handled by StackSocial, our partner who runs Cult of Mac Deals. For customer support, please email StackSocial directly. We originally published this post on Columns AI bar charts maker on February 16, 2025. We updated the pricing.


