GigaOm’s been releasing a slew of admirable, Apple-oriented infographics lately, leading with a fantastic look at the money at stake if AT&T loses the iPhone, and now following with a through vivisection of the thriving App Store economy.
Here’s the jist: 28,000 developers have generated over 133,000 apps to date. Surprisingly, the average approval time is only a little under five days,which is shockingly lower than the collective complaints of Internet developers about long App Store turn-around times… although it’s worth noting that that statistic only applies to apps that are approved, not ones that have been rejected.
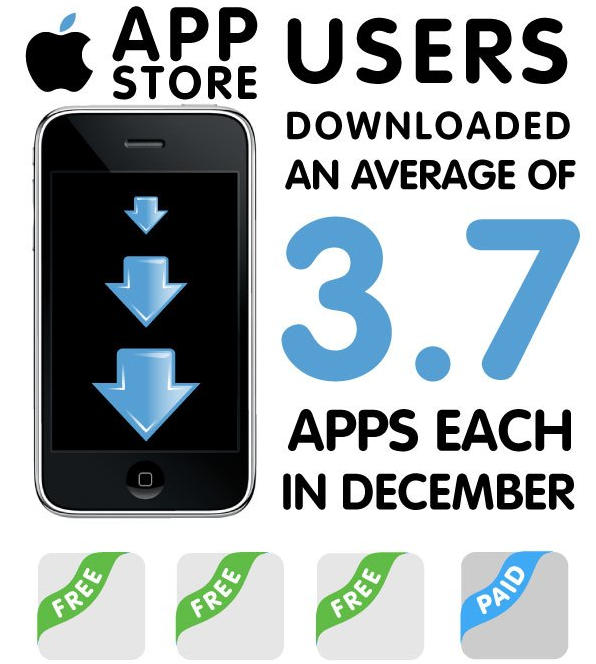
In general, the average iPhone or iPod Touch user downloaded 3.7 apps in December, only 25% of which were paid apps. Ninety nine cents is the most popular price for paid apps, although the average app price goes as high as $2.59. Even given the low margins on most apps, though, December saw renuews of $500MM, with $350MM of that going to developers.
As usual, it would be downright rude to just slurp up and regurgitate the whole graphic, so click through to check the full thing out.


