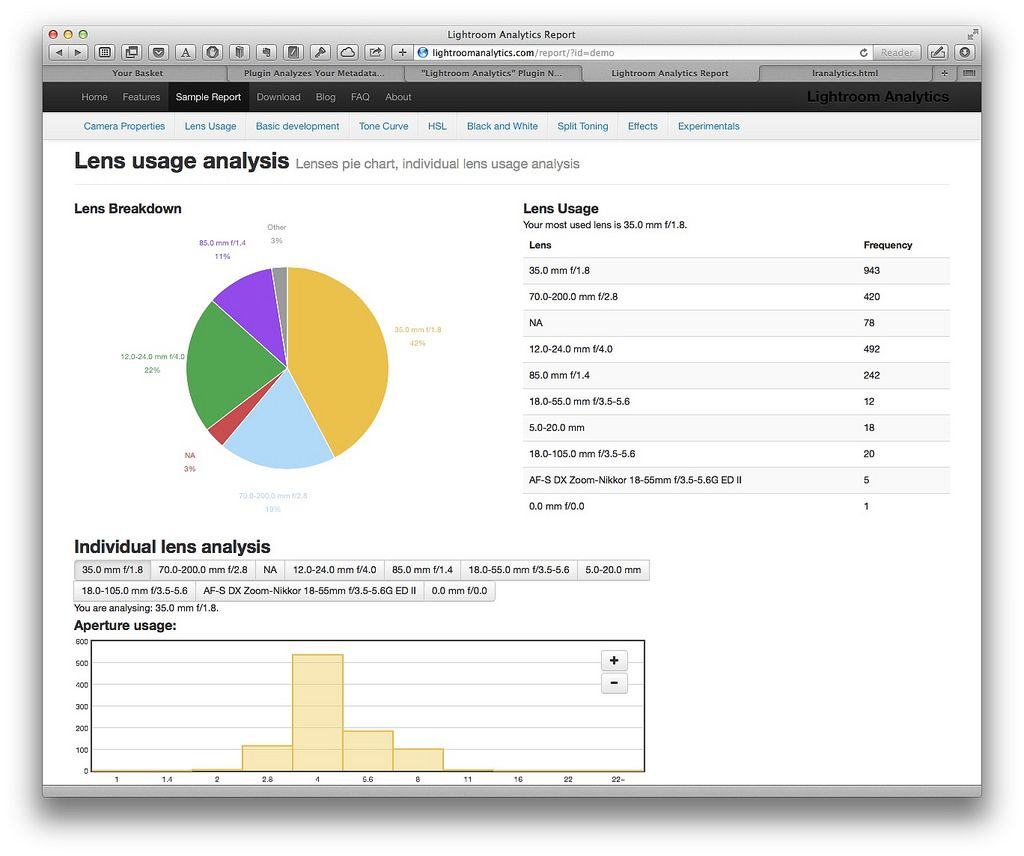
Lightroom Analytics is a plugin that breaks down the metadata in your Lightroom library into all kids of neat and interesting charts and graphs. Want to know what lenses you use the most? Or which setting you always tweak? Then you need LR Analytics.
It comes in two parts – a Lightroom plugin that scours your library and a web app runs locally in your browser (Instructions are on the site – it’s easy to follow along). Once you have told the plugin to export the metadata (which can take a little while depending on the size of your library, but it’s make-a-cup-of-coffee long, not go-out-for-a-walk long).
Then, in Safari, you can view everything, from basic camera settings (per-camera and per-lens in you like), through metering mode to the amount of featuring on a post-crop vignette. Yes, I told you it was interesting.
If you’re a Lightroom user, you should just go get this now. The only possible downside is that you might spend the afternoon poring over the stats. But as the folks at LR Analytics even suggest that you could make a preset based on your most-used settings, you might actually win back that time and more in the future.
Source: Lightroom Analytics
Via: PetaPixel


